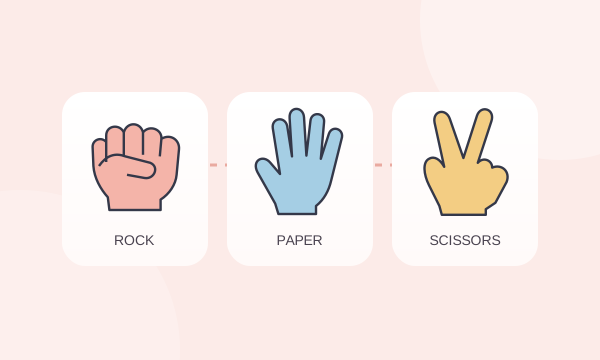
Rock paper scissors is a compact lesson in probability. There are only three moves, but a score can still surprise you: five losses can arrive close together, equal choices can produce several draws, and a short match can look very uneven despite fair rules. Understanding the numbers makes those results easier to interpret.
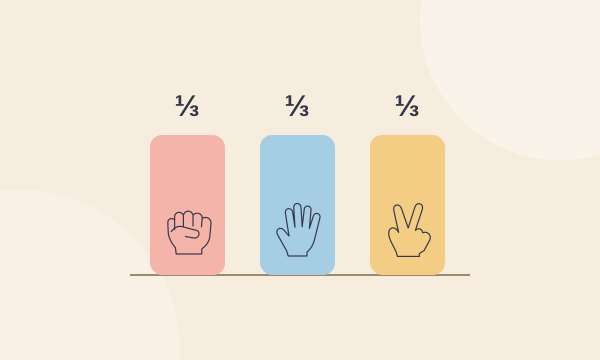
The key assumption is the opponent’s distribution. Against an independent computer that gives rock, paper, and scissors equal chances, any fixed move wins one third of attempts, loses one third, and draws one third. Against a person with habits, those probabilities may differ. This article keeps those two models separate.
Count the possible outcomes
Hold your own choice fixed at rock. A uniform opponent can choose rock, paper, or scissors, each with probability one third. Rock against rock draws, rock against paper loses, and rock against scissors wins. You have exactly one outcome of each type among the three equally likely possibilities.
The same reasoning works if you choose paper or scissors instead. There is no hidden advantage in the names, the illustrations, or the order of the buttons. The rules table shows the full cycle, while the playable game lets you see an explanation after each reveal.
| Result against a uniform opponent | Probability per attempt | Approximate percentage |
|---|---|---|
| Win | 1/3 | 33.33% |
| Loss | 1/3 | 33.33% |
| Draw | 1/3 | 33.33% |
| Decisive result | 2/3 | 66.67% |
Those percentages are rounded. Three displayed values of 33.33% add to 99.99%, but the exact fractions add to one. That small difference is a display issue, not a missing category. Whenever precision matters, work with the fractions first and round only the final presentation.
Nine pairs, three kinds of result
If both sides independently select uniformly, there are nine ordered pairs: three possible first-player choices multiplied by three possible second-player choices. Three pairs are ties, three favor the first player, and three favor the second. Each ordered pair has probability one ninth under these assumptions.
“Ordered” matters because rock versus scissors and scissors versus rock produce opposite results for Player 1. The two pairs contain the same gestures but reverse who wins. This is also why statistics should identify whose wins and losses they record. In our local game, lifetime results use Player 1’s perspective.
Expected results are not promised results
Across 30 independent attempts, the expected number of wins is 30 multiplied by one third, or 10. The same expectation applies to losses and draws. However, expectation is a long-run average over many possible sessions, not a rule requiring your particular session to contain exactly 10 of each.
You might finish with 14 wins, 9 losses, and 7 draws without demonstrating any unfairness. A serious fairness assessment needs a defined test, enough observations, and attention to how the data were collected. Picking a dramatic-looking session after it happens is not the same as testing a prediction in advance.
Why streaks happen
The probability of winning three specified consecutive attempts against this model is one third cubed, or one in 27. That describes a particular three-attempt window. It does not mean a long session containing many overlapping windows has only a one-in-27 chance of showing any three-win streak anywhere.
Likewise, after three losses, the next attempt still has a one-third win probability if the opponent remains independent and uniform. The computer does not owe you a recovery. Believing that past losses force a future win is an example of the gambler’s fallacy, a confusion between past outcomes and unchanged future probabilities.
What changes when draws are replayed?
If you set draws aside and ask who wins the next decisive round, the two players have equal chances: one half each. This is a conditional probability. Of the outcomes that are not ties, one favors you and one favors the opponent. The draw category has been excluded from the question.
For a single decisive result, the expected number of attempts is one divided by two thirds, or 1.5. Some rounds resolve immediately, while others need several ties before someone wins. An expectation of 1.5 attempts does not mean a half-round is played; it is an average across repeated experiences.
Match probabilities
In a fair Best of 3 match, you win either by taking the first two decisive rounds or by winning two of three. The possible winning sequences are WW, WLW, and LWW. Their probabilities are one quarter, one eighth, and one eighth, totaling one half. Draws delay these sequences without changing their winner.
Best of 5 is also symmetric when both players have equal chances on every decisive round. Each side has a one-half chance to win the match. Increasing the target does not create an advantage for either equally matched player, though it changes how long the match lasts and which final scores are possible.
If one player genuinely has a stable edge on each decisive round, a longer format can increase their match-winning chance. That statement depends on the edge persisting. Human adaptation, fatigue, or changing tactics can violate the simple independent-round model, so do not apply the calculation mechanically to every casual game.
Human behavior is a different model
A person may favor one gesture or respond to the preceding result. Wang, Xu, and Zhou’s laboratory study of conditional responses reported structured behavior in repeated rock paper scissors. It shows why a model of perfectly independent human choices can miss useful features of real decisions.
The experiment does not establish a universal gesture percentage for everyone. Its participants, incentives, and pairing arrangement define the scope of its evidence. Our strategy guide explains how to form cautious hypotheses about a specific opponent instead of turning group-level research into an absolute prediction.
How this website chooses a move
The game asks the browser’s cryptographic random-number generator for an unsigned integer. Because the integer range does not divide evenly into three, the implementation discards the single leftover value before assigning the accepted values to moves. This rejection step gives each move the same number of possible integer inputs.
The sampler does not receive your chosen move or your previous results. The chosen computer move is locked before the reveal, and scoring happens afterward. This describes the implementation’s intended fairness mechanism; it does not turn a small observed session into a proof that all future scores must balance exactly.
Frequently asked questions
Is a draw more likely after a draw?
Not against an independent uniform computer. The next draw probability remains one third. A human might react to a tie, but that would be a different behavioral model requiring evidence about that person.
Is repeating rock a fair strategy?
Against a uniform independent computer, repeated rock still has a one-third win chance each attempt. Against a person who notices the repetition, it is easy to counter with paper. Fair odds against one model do not imply unpredictability against every opponent.
Does an uneven scoreboard prove cheating?
No. Short samples can be uneven under fair randomness. Investigating fairness requires more than noticing an unpleasant streak. Look at the mechanism and a properly collected set of outcomes, and avoid treating a single session as conclusive evidence.
Use the numbers to enjoy the uncertainty
Probability explains the space of possible results rather than promising a particular score. Expect variation, distinguish attempts from decisive rounds, and keep assumptions visible. With those habits, a surprising match becomes an illustration of randomness instead of a reason to invent a hidden rule.